WAVEFORM-DERIVED HEAD-MOTION ANALYSIS · UNIVERSITY OF HELSINKI

Peak values tell you how hard.
IFS tells you how.

A multidimensional representation of head-motion waveforms in sport — reading each recorded impact across structural, rotational–translational, spectral, and artefact domains, not collapsing it into a single number.

 structural channel  coupling channel  spectral channel illustrative, not measured data
2 of 6
components explain 96.4% of the variance in peak kinematic metrics — they measure one thing: intensity.
14 of 111
components needed for the IFS structural feature set to reach 80% of variance — several independent mechanical dimensions.
55.3%
of IFS structural variance is mathematically orthogonal to the entire peak-kinematic feature set.

From principal component analysis on 4,402 head-motion events, 34 elite ice-hockey players — see Evidence.

THE STORY

1943: rotation was named as the mechanism. 2026: we still mostly measure how much.

From Holbourn's shear-strain hypothesis to Gennarelli's primate studies to HIC and BrIC — eighty years of evidence that impacts differ in kind, not just magnitude, and no standard that reads the waveform for what it is.

Read the history →
THE PROBLEM WITH A SINGLE NUMBER

Two impacts can share a peak — and share almost nothing else.

Standard wearable sensors report peak linear acceleration and peak rotational velocity: two scalar values summarizing an entire 75-millisecond event. That works as a rough ranking of intensity. It throws away everything about how the event unfolded — waveform shape, the timing between rotational and translational motion, and frequency content.

Two events with identical peak magnitude can differ sharply in duration, symmetry, and spectral character. Those differences are invisible to a peak-based description. They are exactly what the Impact Feature Space is built to represent.
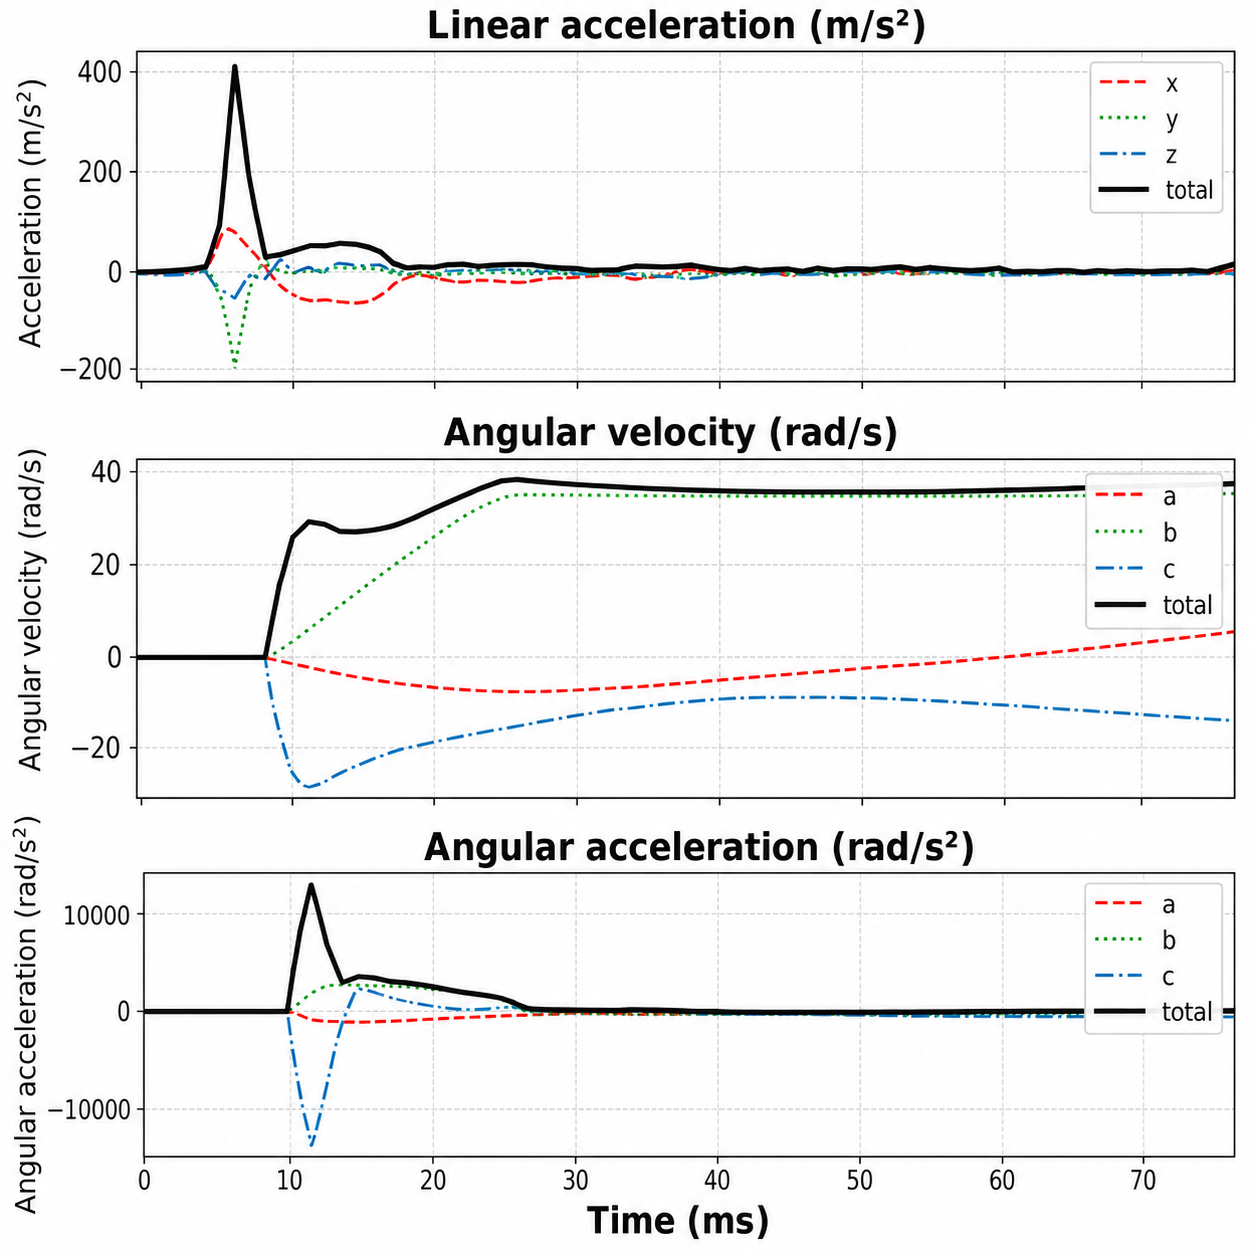
A recorded head-motion event showing linear acceleration, angular velocity, and angular acceleration over 75 milliseconds, from live ice hockey play.
Fig. 1 — A single recorded event from live gameplay: linear acceleration, angular velocity, and angular acceleration across the 75 ms measurement window. The waveform's shape, duration, and frequency content are exactly what a peak value discards.
HOW IFS READS AN EVENT

Six measurement domains, one representation

Every recorded event becomes a point in a multidimensional space. The published manuscript organized this into four domains; the working pipeline has since grown to six. Either way, it's a structured description — not a single scalar summary.

01 · Structural

Waveform shape

Kurtosis, skewness, duration, onset and decay — is the event a sharp transient or a sustained, distributed load?

02 · Spectral

Frequency & time-frequency

Short high-frequency impulses versus longer, lower-frequency contact — and how that content evolves over the event.

03 · Coupling

Rotation ↔ translation

How much of the motion is rotational, how it's timed against linear motion, and how the two are coupled.

04 · Directional

Axis geometry

Which direction the motion concentrates in, and how stable that direction stays through the event.

05 · Anatomical

Plane decomposition

Rotational energy split into axial, coronal, and sagittal components.

06 · Complexity

Signal regularity

How patterned or irregular the waveform is, independent of its size or frequency.

VALIDATED ON LIVE GAMEPLAY

The orthogonality shows up where it matters: telling events apart.

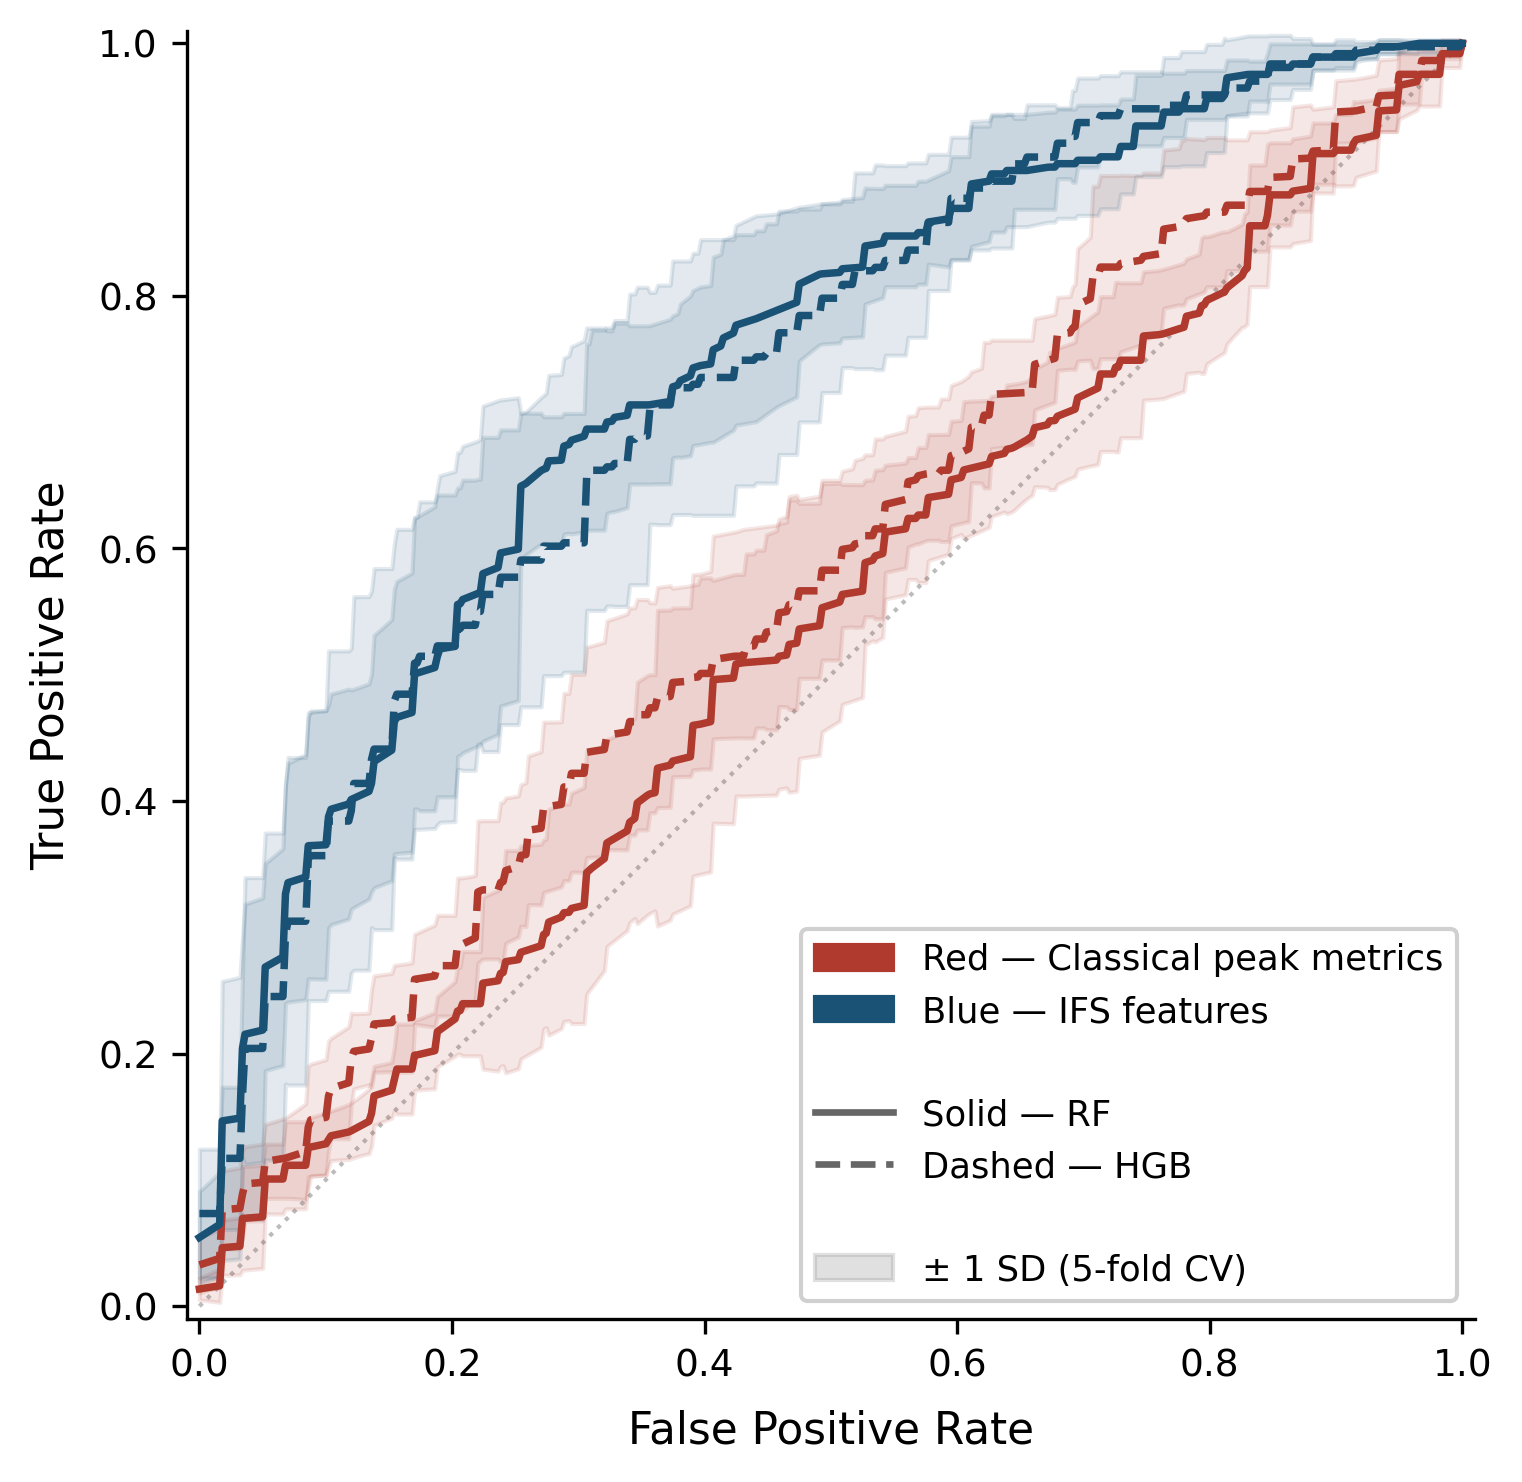
Using 661 events recorded during active gameplay — on-ice contact versus events recorded while seated on the bench, both crossing the same detection threshold, both within the same time window — peak kinematic features classified at chance (ROC-AUC 53–56%). IFS structural features, entered without any task-specific tuning, reached 73–74% AUC with two different classifier families.

Event context was independently confirmed against a separate player-tracking system, not derived from the sensor data itself.

ROC curves comparing classical peak metrics to IFS features for classifying on-ice versus bench-seated events during gameplay.
Fig. 2 — Classifying on-ice vs. bench-seated events during active gameplay (n=661). IFS features (blue) separate the two classes; peak metrics alone (red) perform near chance.
LOOKING AHEAD

Where else could this apply?

The demonstration dataset is women's elite ice hockey. The six-domain structure of IFS is not sport-specific in principle — and that's a hypothesis worth naming plainly, not a finding.